About the LMA
While existing lighting mapping systems show a single ground strike point, the WTLMA shows the three-dimensional shape, extent and development of branched lightning channels. The data are an essential component of modern lightning detection and physics studies, because they reliably map the extent of the in-cloud charge reservoirs tapped by each lightning flash. The data are readily combined with other observations, including weather radar data. The LMA has contributed to regional and national field programs, and supports the Lubbock regional office of the National Weather Service and NOAA's GOES-R Proving Ground and Validation activities.
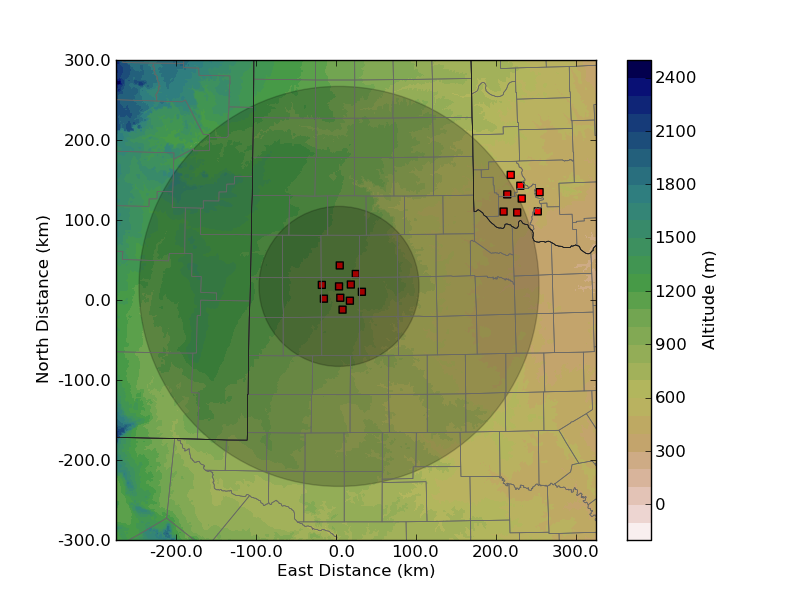 The map above shows WTLMA stations (red squares) in West Texas and in an adjoining LMA in Oklahoma. The inner 100 km range ring shows the extent of the best-quality 3-D detection. Between 100 and 250 km, detection efficiency and vertical precision progressively degrade to a few sources per large flash and effectively 2-D mapping.
Video of data from a supercell, 22 May 2016.
Data are from the Kinematic Texture and Lightning Experiment, our field campaign conducted between 2014-2016, sponsored by the National Science Foundation. Doppler radar data were collected in RHI mode with the TTU Ka Band mobile radars along the lines indicated in the plot.
- WTLMA video, 2250-2251 UTC
- Video from TTU Ka1
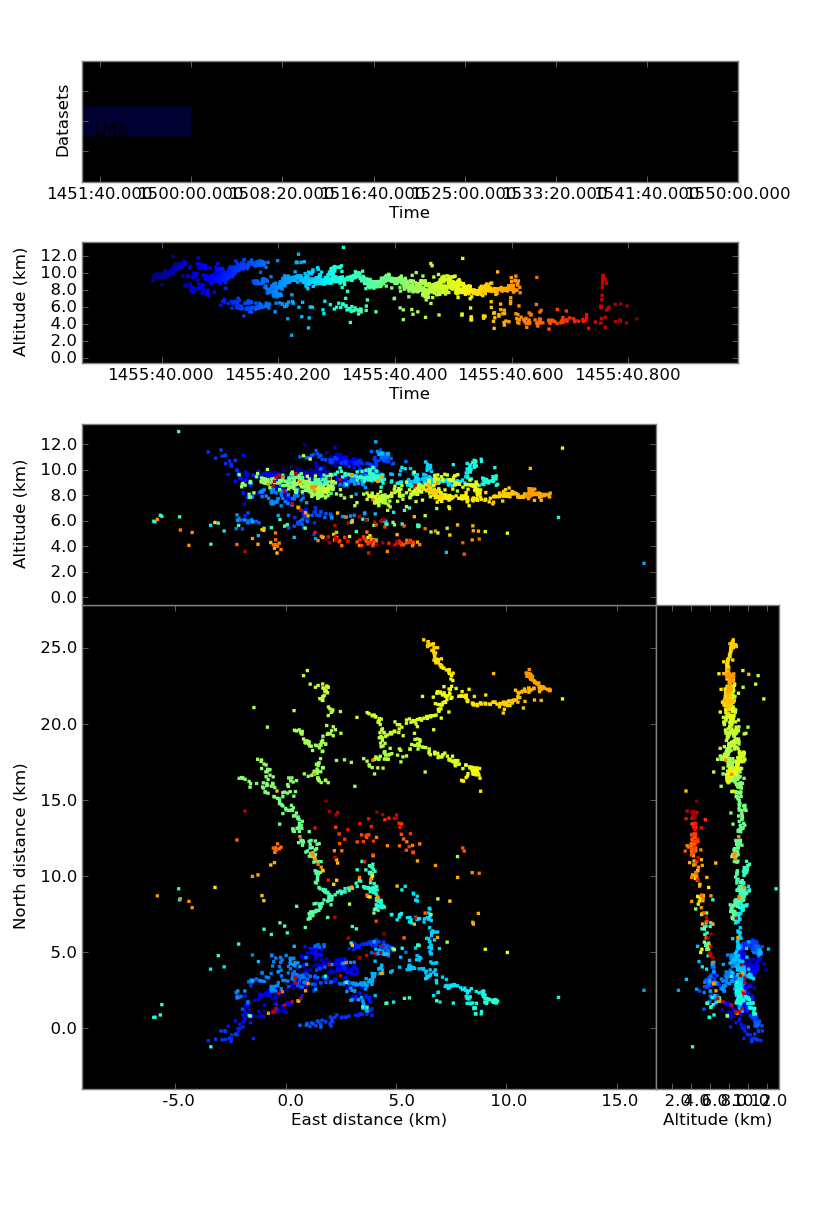
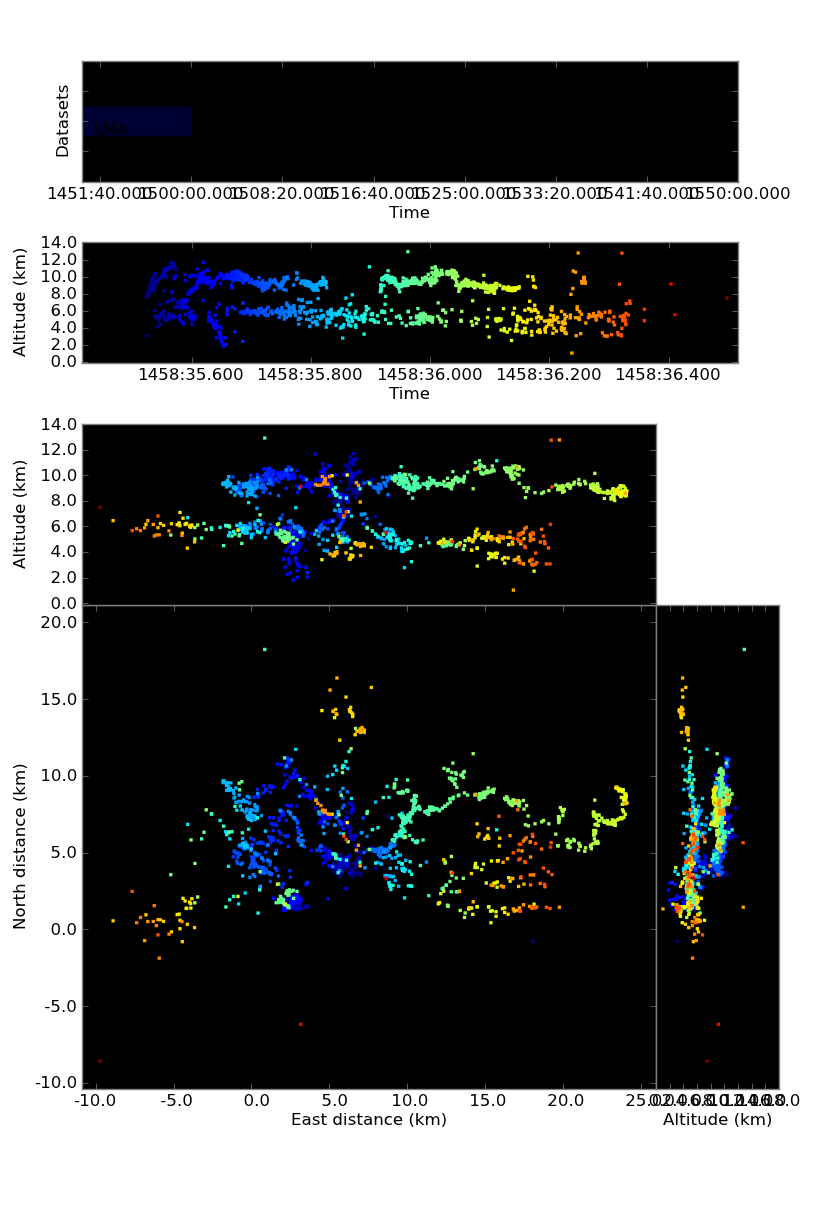
Example flashes from 1450-1500 UTC, 21 Nov 2011
Data using a 6-station preliminary network that was operating on Monday, 21 November 2011. Coordinate system for plots is centered on 200 m tower at Reese Center.
- Flash at 1455:40 UTC. K-change at 1455:40.7 that retraces path back to upper positive charge
- Upper level IC and (probable) lower CG (~1458:35.6 s) showing three main charge layers